Wednesday 29 May 2013

Remote Debugging iOS using lldb...

As per previous post, I attended HITB 2013 Amsterdam in April. I decided to do the mobile hacking course run by Blake Turrentine from HotWan, @Pod2g & @P0sixninja.
One thing I picked up from the course was the remote debugging of user land applications using lldb. In order to do this you need to have the following:
  • A mac with Xcode installed
  • Jailbroken Device (iOS.6.1) running ssh
Step 1 - First you need to mount the DeveloperDiskImage.dmg for 6.1. In a terminal window type the following:
  • hdiutil attach /Applications/Xcode.app/Contents/Developer/Platforms/iPhoneOS.platform/DeviceSupport/6.1\ \(10B141\)/DeveloperDiskImage.dmg
Step 2 - Create a temporary directory on your mac and copy the debugserver to it:
  • mkdir debug
  • cd debug
  • cp /Volumes/DeveloperDiskImage/usr/bin/debugserver . 

Step 3 - Next, you need to code sign the executable using an entitlements file. To make the entitlements file do the following:
  • nano entitlements.plist
  • copy and paste the text below into the terminal window 
<?xml version="1.0" encoding="UTF-8"?><!DOCTYPE plist PUBLIC "-//Apple//DTD PLIST 1.0//EN" "http://www.apple.com/DTDs/PropertyList-1.0.dtd">
<plist version="1.0">
<dict>
    <key>com.apple.springboard.debugapplications</key>
    <true/>
    <key>run-unsigned-code</key>
    <true/>
    <key>get-task-allow</key>
    <true/>
    <key>task_for_pid-allow</key>
    <true/>
</dict>
</plist>

  • press ctrl+x to quit, then Y to save and hit return to exit nano
  • You should have something like below if you cat entitlements.plist 
  • If you don't want to make the entitlements file just download it from the link here
Step 4 - Now you need to sign the executable with the entitlements file you just created:
  • codesign -s  - --entitlements entitlements.plist -f debugserver 

Step 5 - You can unmount the developer .dmg.
  • hdiutil detach /Volumes/DeveloperDiskImage/

Step 6 - Copy the executable to the iPad (this assumes you have ssh running on the device, if you don't you need to do that first). I use usbmux to connect to my iPad via usb, but you could connect via WiFi using the IP address.
  • Starting usbmuxd to forward local port  2222 on my mac to 22 on the remote device
  • Use scp to copy to Device, when prompted enter the password for the root account on your Device (iPad / iPhone). You could use cyberduck or any file transfer application you have. 
  • scp -P 2222 debugserver root@localhost:/var/root

Step 7 - ssh onto the device, start the debugserver and select a port for the server to listen on:
  • ./debugserver localhost:1234 --attach=<TheProcessNameYouWantToDebug>
If you get the error below:

dyld: Library not loaded: /Developer/Library/PrivateFrameworks/ARMDisassembler.framework/ARMDisassemblerReferenced from: /private/var/root/./debugserverReason: image not found


You need to start Xcode with the device connected via usb to your mac and navigate to Window > Organizer (or press cmd + shift + 2) then select the Devices and choose your device from the left hand side pane and ensure the device is configured for development (see apple developer documentation here)


If you are not enrolled in the Apple developer program and have no intention too then you can mount the "DeveloperDiskImage.dmg for 6.1" again (as per step 1) and copy the contents of  /Volumes/DeveloperDiskImage/Library to the /Developer directory on the device. This worked for me before I realised you needed to enrol the device as a development device :) 

Step 8 - If the debug server has started ok and is listening the terminal session will appear to hang as below:


Step 9 - If you are using usbmuxd you will need to ensure the port you just set the debug server to listen on is being forwarded from your mac over usb to the remote port (if you are using IP add to connect to the device you don't need to worry about this).
  • sudo ./Tools/iPhone/usbmuxd/usbmuxd-1.0.8/python-client/tcprelay.py -t 1234:1234

Step 10 - On your mac you can now start lldb 
  • Type lldb at a command prompt
  • Once lldb console has started type platform select remote-ios and hit enter.

Step 11 - Connect to the debugserver running on the device:
  • process connect connect://localhost:1234

Step 12 - You are now attached to the process and can debug using lldb commands
  • register read
  • bt


The following link (http://lldb.llvm.org/lldb-gdb.html) is a gdb to lldb comparison chart that might help if you know the gdb command you want but don't know the lldb command.

I need to do some more work with lldb as I have never really used it, I'm hoping this will be a useful way to look into some apps I have been wanting to reverse for a little while.

Wednesday 22 May 2013

iOS Kernel Debugging USB Cable...

A month or so back I attended Hack In The Box 2013 in Amsterdam. I do a fair bit of work with mobile and have done my share of 'BYOD', 'MDM' and 'MAM' (and probably any other MxM that comes along). I decided if I was gonna take the time to attend the con it would be worth signing up for some of the training too. The obvious choice for me was Mobile Hacking II which was being run by Blake Turrentine from Hotwan. He had enlisted the help of two great iOS hackers, @pod2g and @p0sixninja. Both have made regular contributions to iOS jailbreaking and know a lot about iOS. 

One of the topics @p0sixninja covered was finding bugs in iBoot. To do this you need a special USB to serial 30 pin connector. This isn't new, it's an area @i0n1c did a lot of the initial research on back in 2011. He also presented his findings at Blackhat (http://media.blackhat.com/bh-us-11/Esser/BH_US_11_Esser_Exploiting_The_iOS_Kernel_Slides.pdf). He discovered that you could create a USB serial cable that would allow you to connect to the iOS kernel via KDB and debug what was going on. In order to do this you obviously need to create the USB cable, I don't have one so decided to order the parts and try to knock one up. @HackerFantastic has a good write up over on instructables (http://www.instructables.com/id/Apple-iOS-SerialUSB-Cable-for-Kernel-Debugging/?ALLSTEPS)  that is also well worth a look.

Here are my instructions and what I did….

Ingredients:
You will need the following components in order to create the USB serial debugging cable.

1 x PodGizmo (30pin) (http://proto-pic.co.uk/podbreakout/)


1 x FT232RL USB to Serial Breakout Board (http://proto-pic.co.uk/breakout-board-for-ft232rl-usb-to-serial/)


Single Core Hook up Wire /  Bell Wire (http://proto-pic.co.uk/hook-up-wire-assortment-solid-core/


Utensils: 
Wire Cutters
Soldering Iron
Solder
3 x pairs of hands and patience (if you haven't soldered before).

I cocked up and didn't get the 'Single core Bell / Hook up wire'. Being a bit impatient and waiting to give this a go asap I decided to try using some dodgy old flex from a 240v lamp (see picture), my soldering skills aren't great but trying to do it this way was a nightmare. 


My first tip would be buy your self some hook up wire or single core bell wire. I ended up running to Maplin the next day to get some as it was turning into a train smash. This is what I purchased http://www.maplin.co.uk/solid-core-wire-1-0.6-6187.

Following the steps below you should be able to create a cable similar to the one I have:

Step 1 - Cut 4 pieces of bell wire about 3 cm's in length and strip back a small amount on each end.

Step 2 - Tin each end of the bell wire using the soldering iron (if you haven't soldered before this might help http://www.instructables.com/id/Strip-and-Tin-Wires-Like-a-Pro/)

Step 3 - Solder a piece of the bell wire to each of the GND / RX / TX / 3.3v pins on the USB to serial break out board.


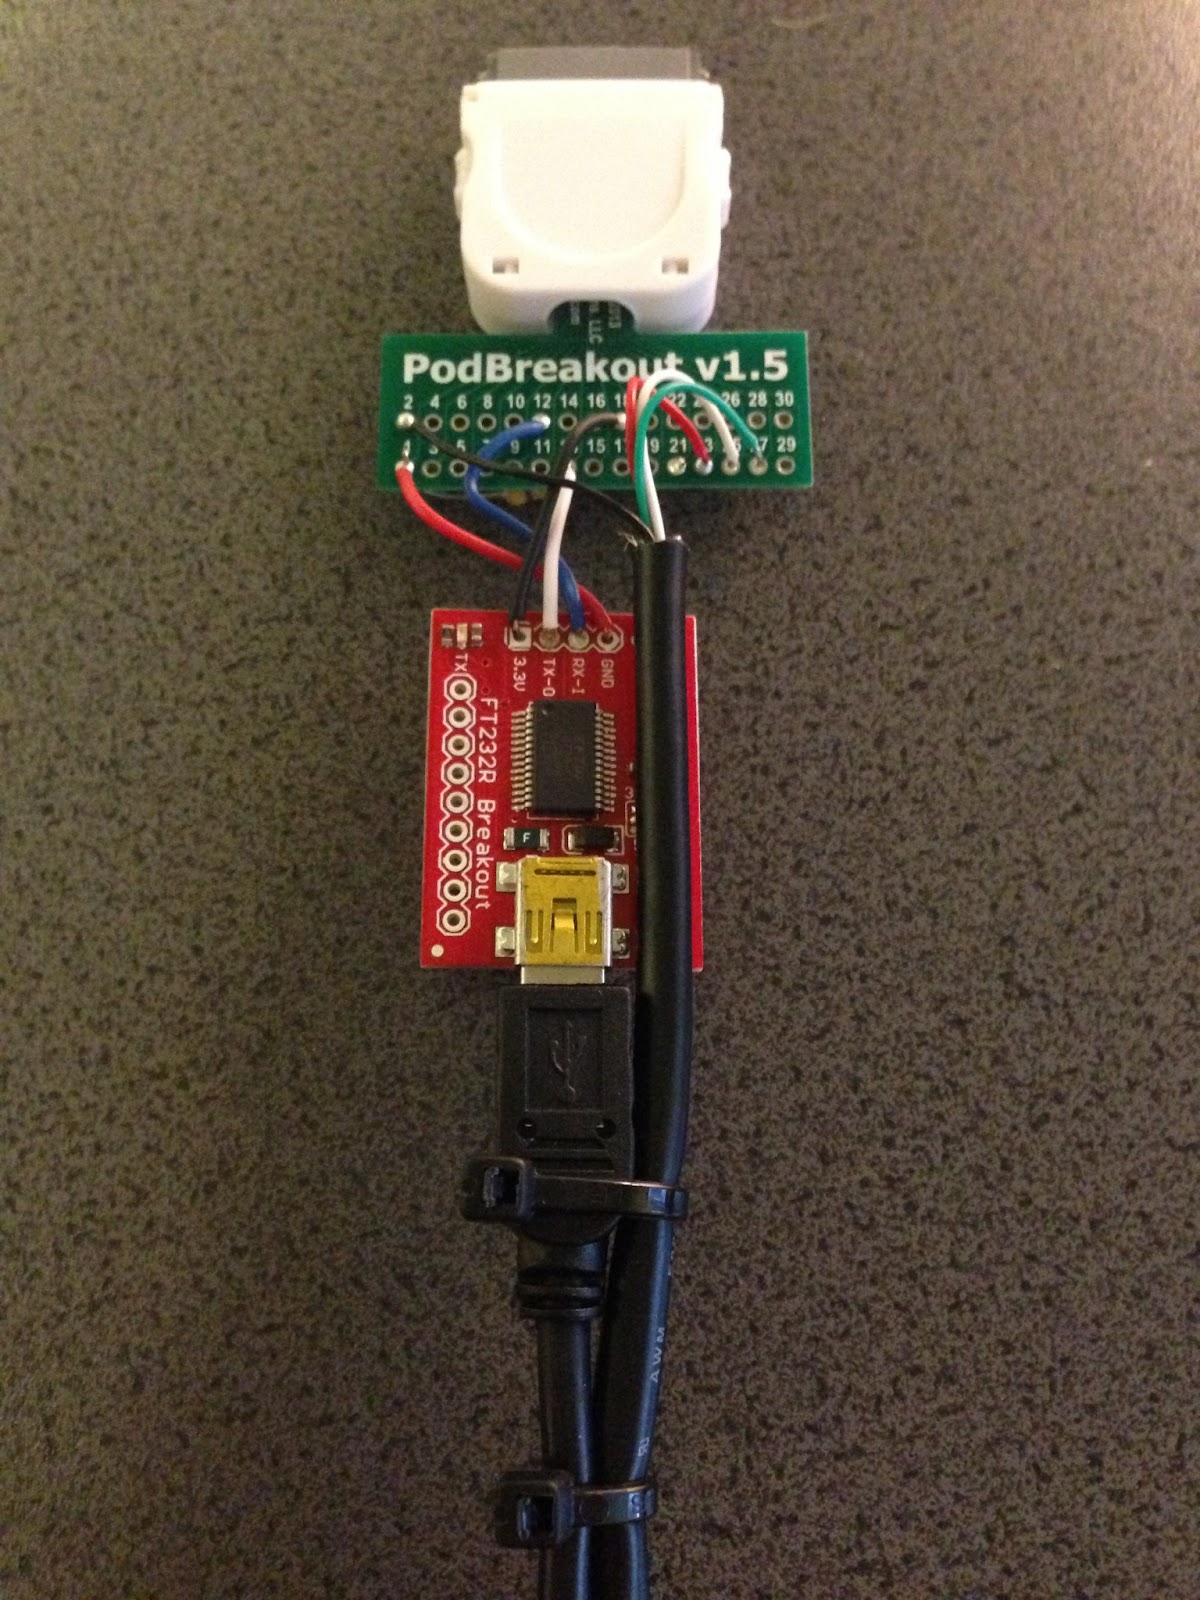
Step 4 - Solder one end of the resister and the wire connected to the GND pin on the serial break out board to pin 1 on the pod break out board (In the picture below Red Cable to pin 1). This bit is a real PITA as you have to manage both the resistor and the wire whilst trying to solder.

Step 5 - Solder the wire in RX pin on the USB to serial break out board to pin 12 on the pod breakout board (In the picture below Blue cable to pin 12).

Step 6 - Solder the wire in TX pin on the USB to serial break out board to pin 13 on the pod breakout board (in the picture below White cable to pin 13).

Step 7 - Solder the wire in 3.3v pin on the USB to serial break out board to pin18 on the pod breakout board (in the picture below Black cable to pin 18).  


Step 8 - Solder the loose end of the resistor to pin 21 on the pod break out board.

Step 9 - Cut the end of a usb cable and strip back the shielding cable to show the 4 wires of the USB cable, these will likely be black, red, white and green.

Step 10 - Tin the ends of each of the black, red, white and green USB wires.

Step 11 - Solder the black USB cable to pin 2 on the pod break out board.

Step 12 - Solder the red USB cable to pin 23 on the pod break out board.

Step 13 - Solder the white USB cable to pin 25 on the pod break out board.

Step 14 - Solder the green USB cable to pin 27 on the pod break out board.

The finished iOS Kernel debugging cable should look like this (I added some cable ties to hold it together a bit).


If you connect an iPhone or iPad (30pin connector not 5 or Mini) to the pod break out and then plug the usb cables into your mac you should see the devices under USB as below:


I have also tried to create a video of the first 2/3 of the process as I ran out of memory on the iPad I was recording on, and my "ginga" barnet gets in the way a lot...  It doesn't include the soldering of the USB cable wires to the pod breakout board but part of the process is there. Unfortunately it's not great, my soldering skills are now marginally better than the camera skills ;-) 


Hopefully I'll get some time to play with iBoot and write a fuzzer for the kernel... 


Tuesday 21 May 2013

AlfredApp...


Every now and then application comes along that blows my mind, it’s a killer app, I get hyped about and I can no longer live without it…

I am a big fan of the command line and love to use the keyboard and shortcuts. If I can do it in a shortcut and a few key presses, it’s usually better than reaching for the mouse or track pad. I like working this way, it’s quick and tests my brain, sort of, it’s a bit like trying to remember the “finishing moves” mortal combat back in the 90s. 

So whats this all about…. @AlfredApp!! 

I installed Alfred a few months back as a demo, I read a bit of the blurb but didn’t really take it in. I played round with the fee trial and thought it was ok, it’s a bit like spotlight, why do I need another spotlight? Apple already created it, it works well helps me find stuff easily! I decided to leave Alfred where it was and not bother with it again until I read a blog post from @1Password (another killer app). It looked kind of handy that you could invoke Alfred (alt+space bar), type 1P and then the name of the page you wanted to log into and the browser would launch and log you in. I have a few home routers, a NAS and other devices with web interfaces round the house that would be really handy if I could do this for. 

I decided to revisit the Alfred demo and pay more attention to it, within half an hour I was sold! I had bought the power pack and was deep under the bonnet of Alfred.

1st stop features, using alfred features is really easy and helps you get things done quickly. Features are the built in functions of Alfred that the core developers have built in for you. You can simply invoke alfred by hitting alt + space together (or any other hot key combo you define) which launches the alfred interface. In the search bar you can then search your contacts, search the dictionary for a word you want to spell, empty the trash, launch any application or ask 1password to to open a link and inject the credentials. All really simple stuff that help you move quickly through apps.


 Some of the System features are really handy, if you are moving from windows to osx you might miss things like ctrl+alt+del to lock the screen. This has been built into features so that all you need to do is alt+space then type “lock”. Alfred locks the desktop for you.


Other system features include:


After playing with the features I started to look at Workflows, these seemed interesting but needed a bit more thought. Within the workflows you have the ability to customise how you want alfred to behave, what you want it to launch and how you want it to search. You can pass it a search term, which in turn can call a python script and return you some data. This can be displayed in huge writing on the screen or a simple notification in the notification centre.

I decided to start with a simple script. All it would do is work out my public IP and display it, nothing ground breaking but pretty handy. To do this I would call a bash script that would query checkip.dyndns.org and then display the result to the screen. 

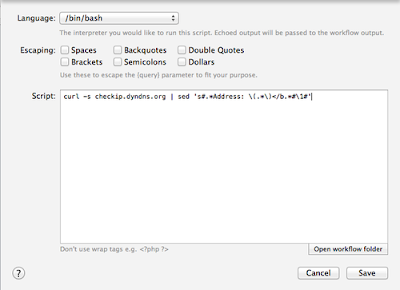
First off I added a new workflow and defined a “keyword” of myip. This would in turn call a /bin/bash script that used to curl and sed to work out my address, the result of which would be pushed to the screen via the notification system, here it is: 


Within 10-15 mins I had created a handy little tool. 

If you are not of a programming background knocking some of these up might be a bit of a challenge, fear not… the internets have done the hard work. Just looking around the web and a link (see bottom of post) from @_amitsbajaj I have found a load of workflows that I think are awesome. Below are a few I’m using:

Currency Convertor - Does what it says on the tin, you pump in the value in the currency you have and it spits out the GBP using google finance to calculate.


Dig - Makes DNS queries quick and simple, also can handle different types of DNS queries by passing in the type at the end e.g. dig bbc.com MX would give you the MX records.


Space - Quickly shows remaining disk space 


Skype - There are a number of commands that let you instantly message your contacts or make a call.


Check out the links below for more on Alfred and workflows: